| Citation: |
Dawei Wang, Fangxu Lin, Shaojun Guo. Operando-captured O-529 eV signal: an indicator of active phase formation below OER potential[J]. Energy Lab, 2024, 2(3): 240021. doi: 10.54227/elab.20240021

|
Operando-captured O-529 eV signal: an indicator of active phase formation below OER potential
-
Abstract
-

-
References
1. S. Chen, S. Zhang, L. Guo, L. Pan, C. Shi, X. Zhang, Z. -F. Huang, G. Yang, J. -J. Zou, Nat. Commun., 2023, 14, 4127 2. T. Li, O. Kasian, S. Cherevko, S. Zhang, S. Geiger, C. Scheu, P. Felfer, D. Raabe, B. Gault, K. J. J. Mayrhofer, Nat. Catal., 2018, 1, 300 3. Z. Chen, Q. Fan, J. Zhou, X. Wang, M. Huang, H. Jiang, H. Cölfen, Angew. Chem. Int. Ed., 2023, 62, e202309293 4. S. Zuo, Z.-P. Wu, H. Zhang, X. W. Lou, Adv. Energy Mater., 2022, 12, 2103383 5. D. Zhou, P. Li, X. Lin, A. McKinley, Y. Kuang, W. Liu, W.-F. Lin, X. Sun, X. Duan, Chem. Soc. Rev., 2021, 50, 8790 6. Z. Wang, W. A. Goddard, H. Xiao, Nat. Commun., 2023, 14, 4228 7. M. Klingenhof, H. Trzesniowski, S. Koch, J. Zhu, Z. Zeng, L. Metzler, A. Klinger, M. Elshamy, F. Lehmann, P. W. Buchheister, A. Weisser, G. Schmid, S. Vierrath, F. Dionigi, P. Strasser, Nat. Catal., 2024, 7, 1213 8. M. Bernt, A. Siebel, H. A. Gasteiger, J. Electrochem. Soc., 2018, 165, F305 -
Rights and permissions
This is an open access article under the terms of the Creative Commons Attribution License, which permits use, distribution and reproduction in any medium, provided the original work is properly cited.
Figures(2)
Information
Article Metrics
Export File
Citation
Dawei Wang, Fangxu Lin, Shaojun Guo. Operando-captured O-529 eV signal: an indicator of active phase formation below OER potential[J]. Energy Lab, 2024, 2(3): 240021. doi: 10.54227/elab.20240021
Format
Content
 DownLoad:

-
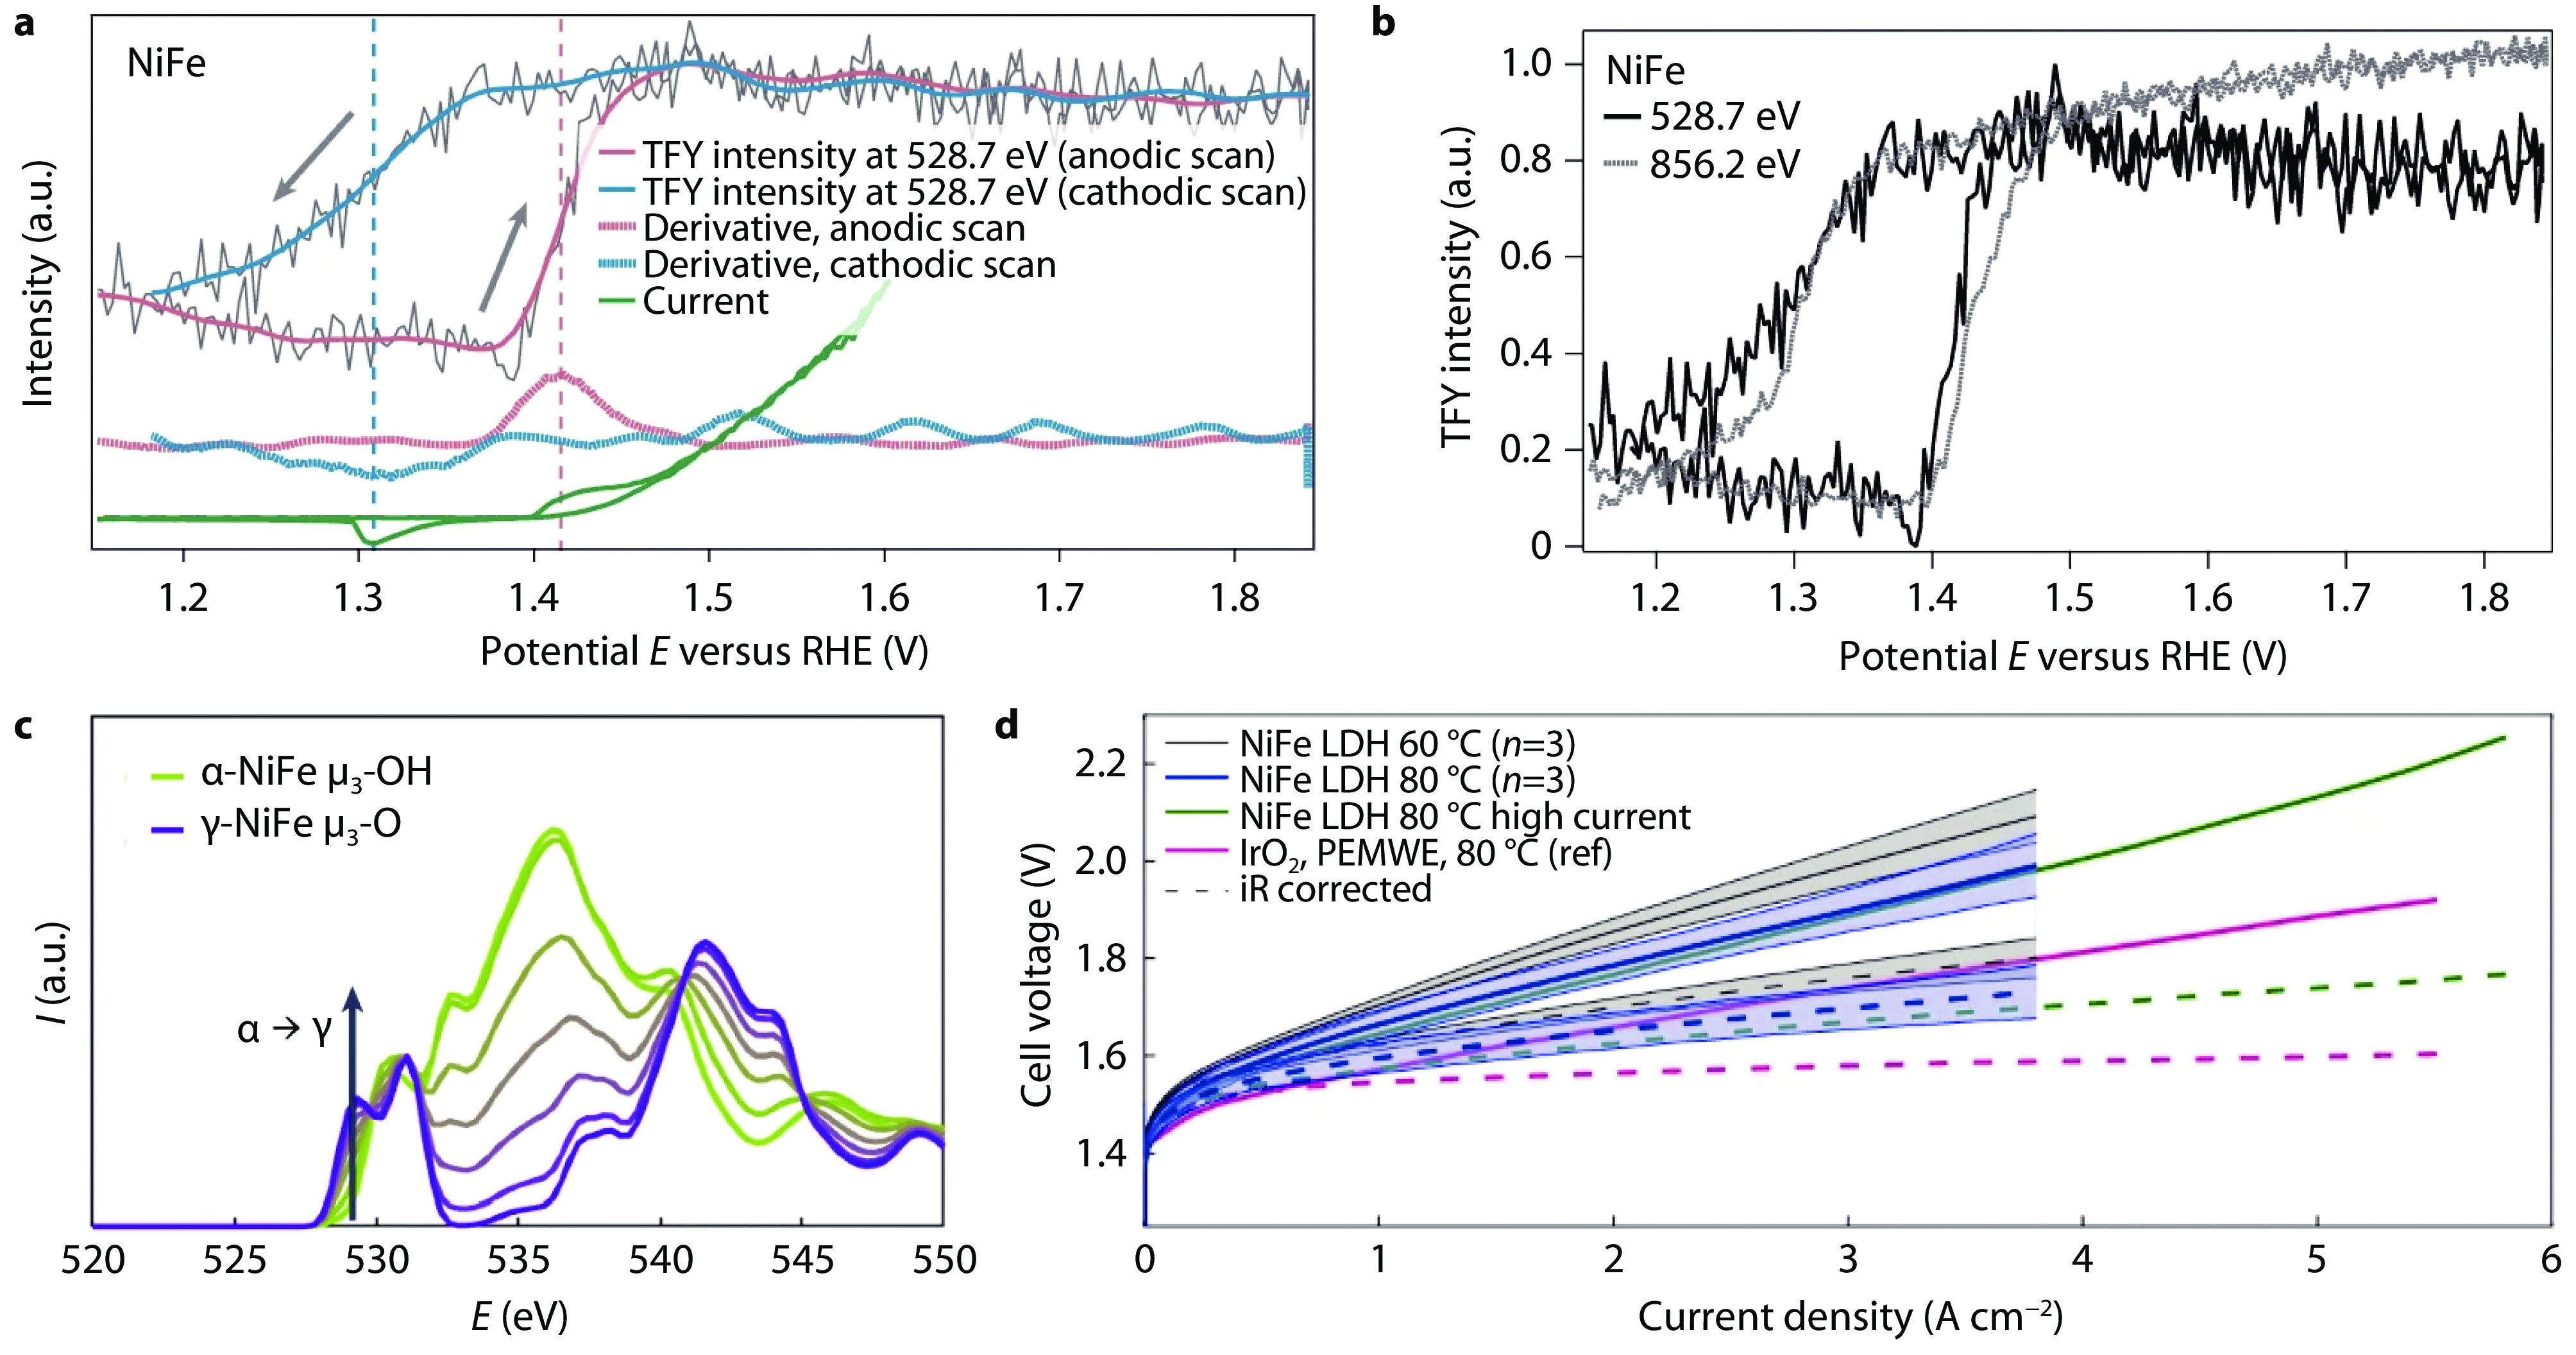
Figure 1.
a Comparison of the TFY intensity at the maximum of the pre-edge feature (528.7 eV) as a function of the applied potential during CV, with its first derivative and the corresponding CV for NiFe LDH. b Comparison of the TFY signal at 528.7 eV and at 856.2 eV for NiFe LDH. The measurements were conducted in 0.1 M KOH at room temperature. c Average O K-edge (normalized) of all oxygen atoms at the hollow sites of α- and γ-phases, with the combination of various α/(α+γ) ratios of 0.1, 0.3, 0.5, 0.7 and 0.9. d Polarization curves of CCM-based AEMWE single cells with 1.0±0.2 mgNiFe-LDH cm−2 and 0.5±0.1 mgPt cm−2 in 1 M KOH. The magenta line represents the state-of-art PEMWE polarization [8]. Shaded areas show 95% confidence intervals (n=3; individual cells). Dashed lines denote high frequency resistance (HFR)-corrected curves.